26.10.2023 Regression#
Intro#
Dependent Variable = intercept + ß explanatory variable + error
\(\beta\) estimated with Ordinary Least Squares (OLS)
explanatory variable = should be exogenous
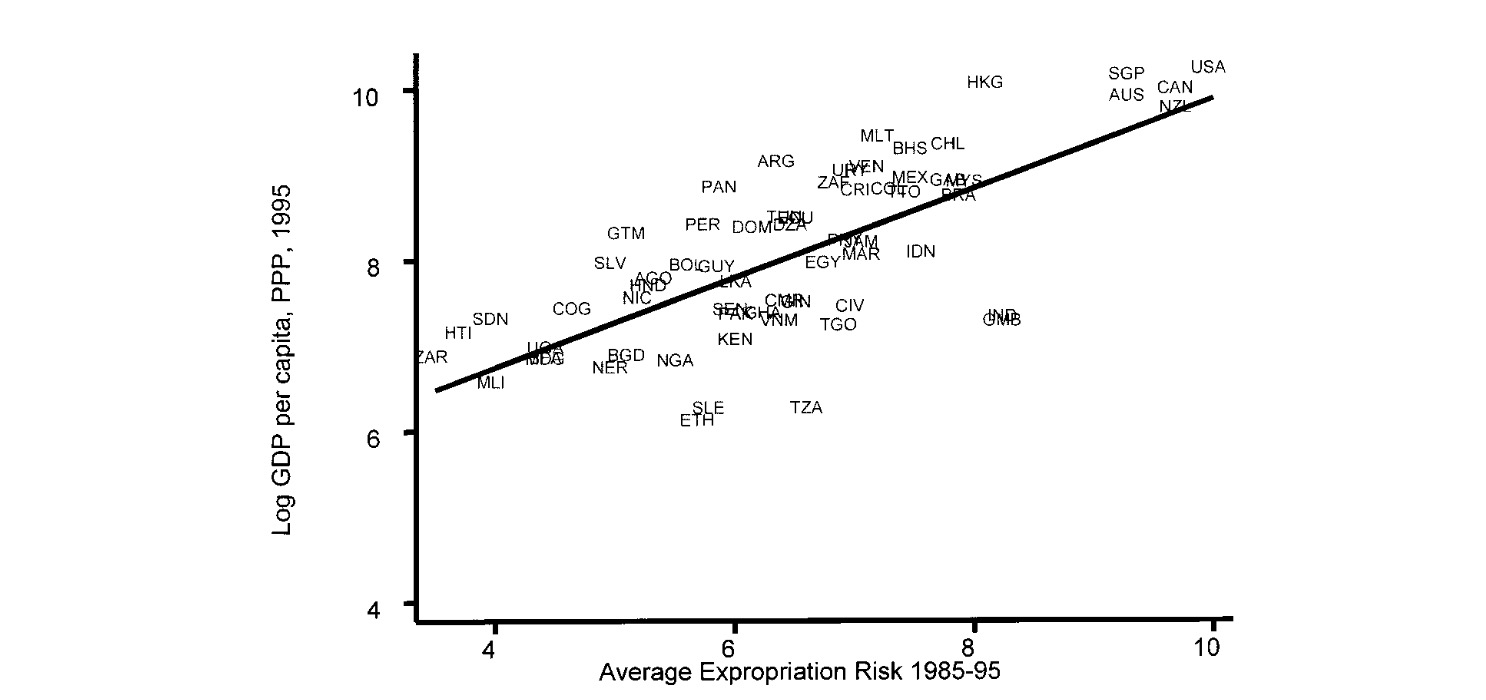
Acemoglus Regression#
Formula
Figure:

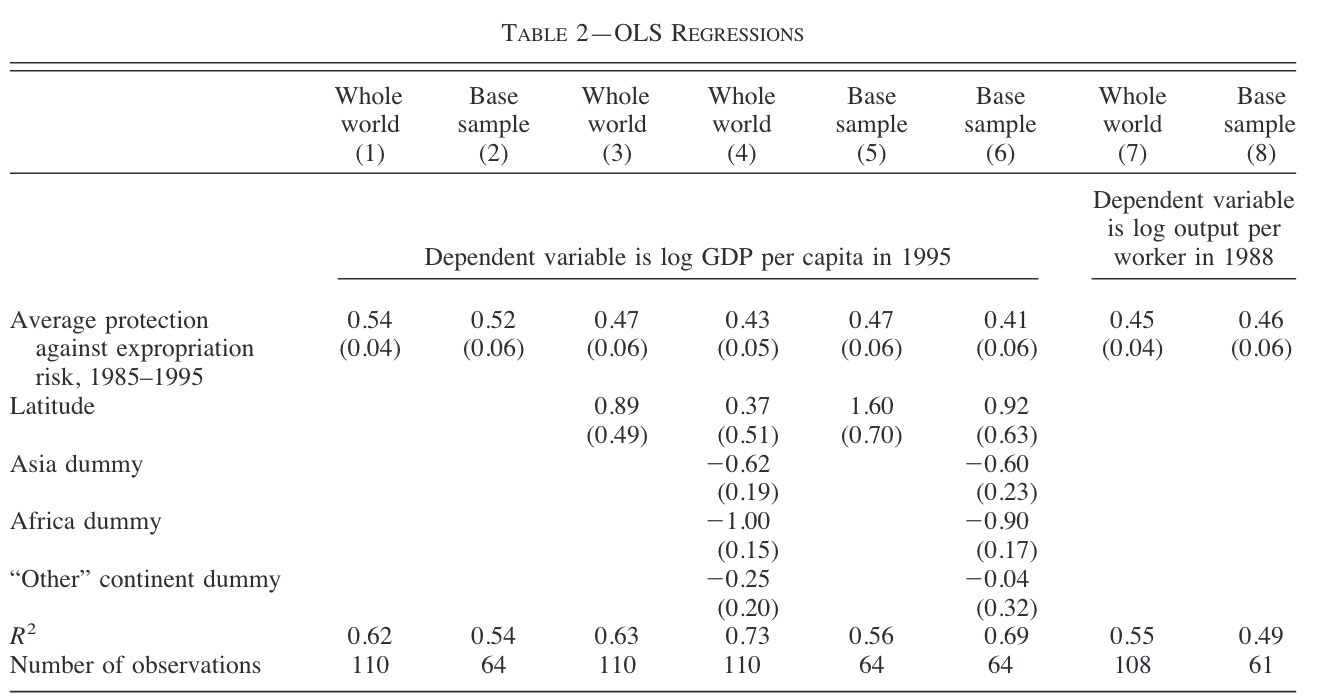
Table:

empty lines = not included in regression
every new sample = broader regression formula with dummies etc.
\(R^2 = 0.62\): goodness of fit of regression line
quite good here (explains 62% of the variance)
Sample 7/8 new dependent variable to make it more solid
Interlude: Regression Interpretation#
Modell |
Abhängige Var. |
Erklärende Var. |
Interpretation |
|---|---|---|---|
Level-Level |
y |
\(x_j\) |
\(\Delta \hat{y} = \beta_j \Delta x_j\) |
Level-Log |
y |
\(log(x_j)\) |
\(\Delta \hat{y} = \frac{\beta_j}{100} \% \Delta x_j\) |
Log-Level |
log(y) |
\(x_j\) |
\(\% \Delta \hat{y} = 100 \beta_j \Delta x_j\) |
Log-Log |
log(y) |
log(x) |
\(\% \Delta \hat{y} = \beta_j \% \Delta x_j\) |
=> ours is log-level
Recreation of the Table#
library(stargazer)
load("data/dataset_AJR2001.Rdata")
head(data)
Table 2: Estimation of Models 1-4 for both datasets
Table Column Names:
logpgp95= Log GDP per capita, PPP, 1995avexpr= Average protection against expropriation risk, 1985-1995baseco= Dummy variable for countries in the base sample (colonized)lat_abst= Absolute value of latitudeloghjypl= Log output per worker in 1988 (US normalized to 1)
m_T2_world_1 <- lm(logpgp95 ~ avexpr, data=data)
m_T2_base_1 <- lm(logpgp95 ~ avexpr, data=data[which(data$baseco==1),])

#latitude added
m_T2_world_2 <- lm(logpgp95 ~avexpr + lat_abst,data=data)
m_T2_base_2 <- lm(logpgp95 ~ avexpr + lat_abst, data=data[which(data$baseco==1),])

# continent dummies
m_T2_world_3 <- lm(logpgp95 ~avexpr + lat_abst + asia + africa + other,data=data)
m_T2_base_3 <- lm(logpgp95 ~ avexpr + lat_abst + asia + africa + other, data=data[which(data$baseco==1),])

# other dependent variable
m_T2_world_4 <- lm(loghjypl ~avexpr, data=data)
m_T2_base_4 <- lm(loghjypl ~ avexpr, data=data[which(data$baseco==1),])
Summary of the first Regression
summary(m_T2_world_1)
Now we have the Regression Models, but until now no Table to present these
#| results: asis
all_res <- list(
  m_T2_world_1, m_T2_base_1,
  m_T2_world_2, m_T2_base_2,
  m_T2_world_3, m_T2_base_3,
  m_T2_world_4, m_T2_base_4
  )
coef_names <- c("Average Protection", "Latittude","Asia dummy", "Africa dummy", "Other")
note <- "Nitzuen lorem"
stargazer(all_res,
          type="html",
          out="data/Table2_stargazer.html", omit = "Constant",
          notes.label = note,
          dep.var.labels = c("log GDP per Capita", "log output per worker"),
          covariate.labels = coef_names
          )