15.11.2023 Cost Benefit Analysis#
CBA: Comparison of Costs / Benefits of public goods / projects to decide if they should be undertaken
Measuring Costs#
Example Costs:
Capital Costs
Operation C.
Maintenance C.
Non-Monetary C.
but very important:
Opportunity Costs!
Rents
Opprotunity Costs in imperfect markets#
Project Hours = 500.000
project wage = 25$
but real comp. wage = 20$
Discounting#
how to count costs over time? discount value
Choice of r = very important
1% UBA
7% US Government
Measuring Benefits#
Value of Time Savings#
Approaches;
Martket based = wages
time savee = valuet at wage
problems: nonmonetary aspects of job
survey based
hypothetical questions
embedding effect = difficulty to value things in larger context
people dont know their valuations
revealed preferences
market prices = reveal the individual preferences
bias problem
Types of Revealed Preferences
Hedonic Market Analysis = regression with a lot of controls
Natural Experiments = naturally occuring variation in prices, how much people want to wait
e.g.: different prices at gas stations, but longer queues
Value of Lives saved#
= most difficult issue
Approaches:
Market based (lifetime wages)
poorer people = worth less
older people = worth less
survey based (value of statistical life)
ask for willingness to pay for certain risk
revealed preferences
compensating differential = higher wages for deadlier jobs (coal miners)
Problems:
Information
Probabilities
Bias
Heterogenity
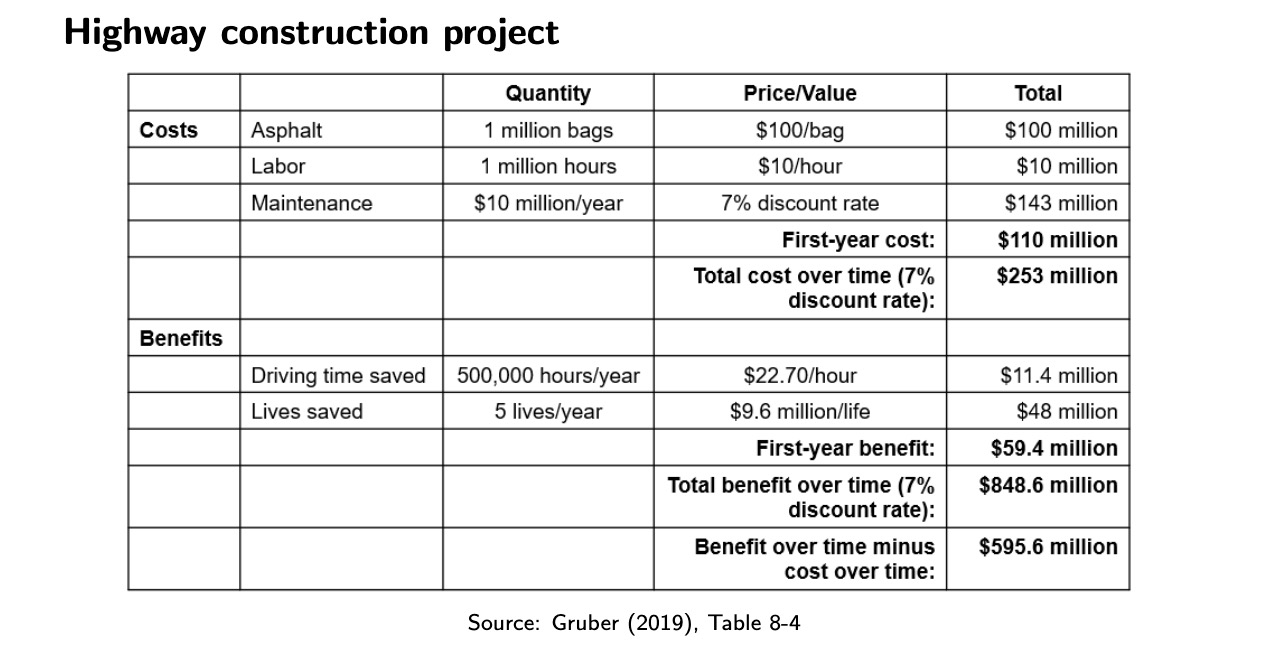
Example Project

Issues#
Counting Mistakes
Uncertainty (gov prefer certain projects = no risk = lower returns)
Distributional Concerns (Costs and Benefits to different people)
Alternative:
Cost-Effectiveness Analysis: projects with immeasurable benefits => most effective project for goal
Critique of CBA#
not part of the lectrúre, but very important (Wiki-Link)
Distribution
no account of dsitribution issues
only net-benefit for all people (Kaldor Hicks)
utilitarian approach (1$ for 1 million people worse than 2 million to one person)
Discounting
discounting value of benefits to future generations
ignore preferences of future generation
Marginal Utility
rich people = lower marginal utility
no symmetry in agents
Exercise#
Exercise 3: City of Metropolia
Example:
new Metro,
Commuters save 15 min driving time, 5 days a week, 50 weeks
Housing Price goes up 10000€
Discount Rate 5%
Math
Hours saved (valued today): \(15*5*50 = 3750 min = 62.5h\)
Present Discount Value: \(\frac{ 62.5 }{0.05}\)
set equal to house price increase: \(\frac{ 62.5 }{0.5}= 10000 \to 8\)
Value of hour saved = 8
Exercise 4
Country A: risk of death = 1/20000, Cost = 5000€
Country B: risk of death = 1/30000, Cost = 5600€
Value of Life:
Risk Difference \(\frac{ 1 }{20000}- \frac{ 1 }{30000} = \frac{ 1 }{60000}\)
Willingness to pay: 600$
Value of Life: \(\frac{ 600 }{1/60.000} = 36.000.000\)
Exercise 5: Jellystone Park
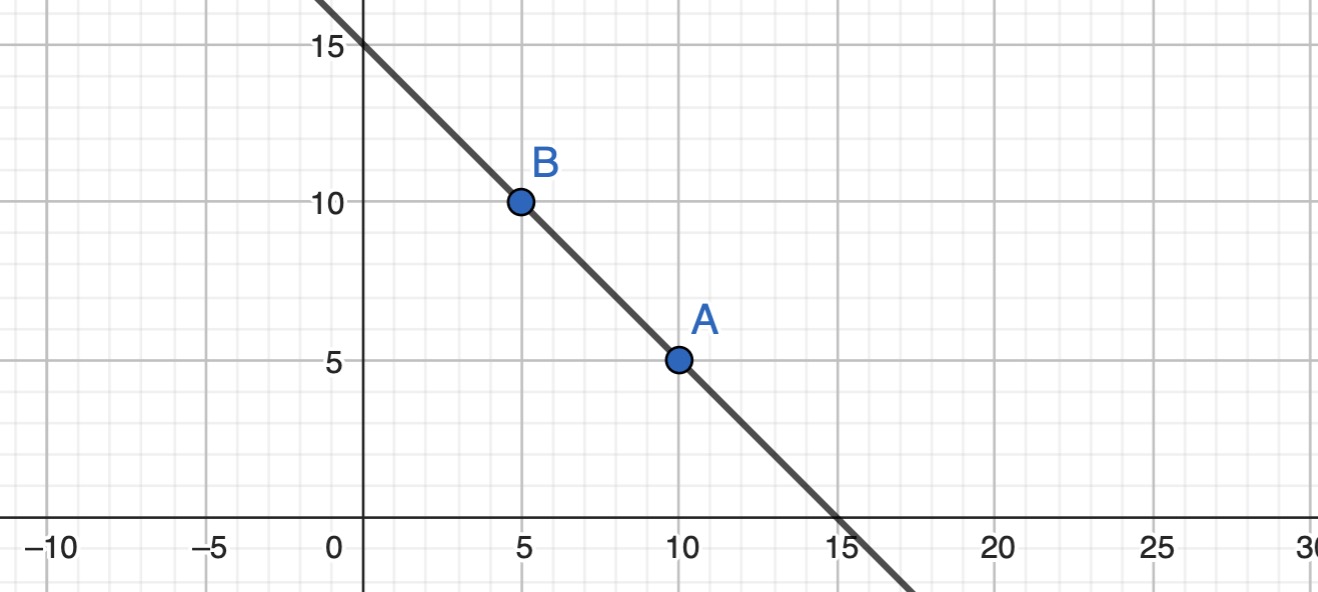
City A: Price=5, Quantity = 10
City B: Price= 10, Quantity = 5
Calculate individual demand curve:
a*5+b = 10
a*10+b= 5

a*10+b = a*5+b-5

5a = -5
a = -1

-10 +b = 5
b = 15

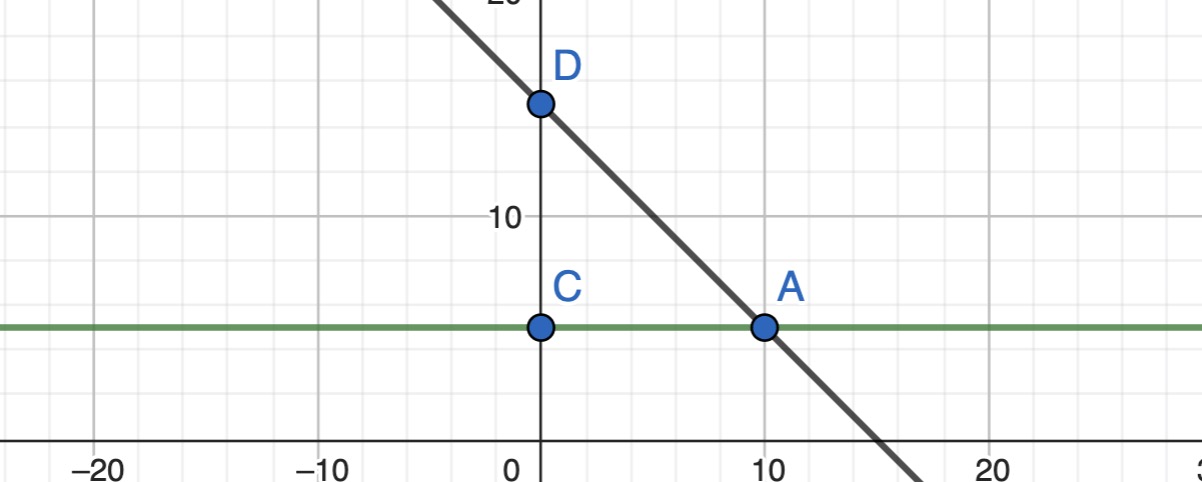
=> -1x+15 = p

Consumer Surplus $\( \frac{ (Price_{intercept} - Price_{market}) * Quantity}{2} \)$
City A: \(\frac{ (15-5) *10}{2} = 50\)
City B: 12.5
